Building a fairness argument is child's play
Revisiting the Fairness Index to look at a live issue shows that it remains a useful tool to explore and explain the nature, causes and consequences of key inequalities



As the father of two small-ish kids, I’ve spent more than my fair share of time kneeling on the floor, swishing through an ever-growing pile of LEGO® bricks in a vain search for the crucial missing piece, which is invariably miniscule and the same colour as the carpet. And we are way too far gone to even think about buying one of those special filing cabinets to separate all the pieces by set, or colour, or some more esoteric category.
Even so, you’ve got to love LEGO. What I like about it is that a child - or an adult - can quickly build something all of their own (assuming that you have branched out beyond following the instructions that came with your set). Your creation is unique. But you didn’t have to individually mould each brick or minifigure - that was done for you. You just had to stick them together in a way that no one else had ever done before (as far as you know).
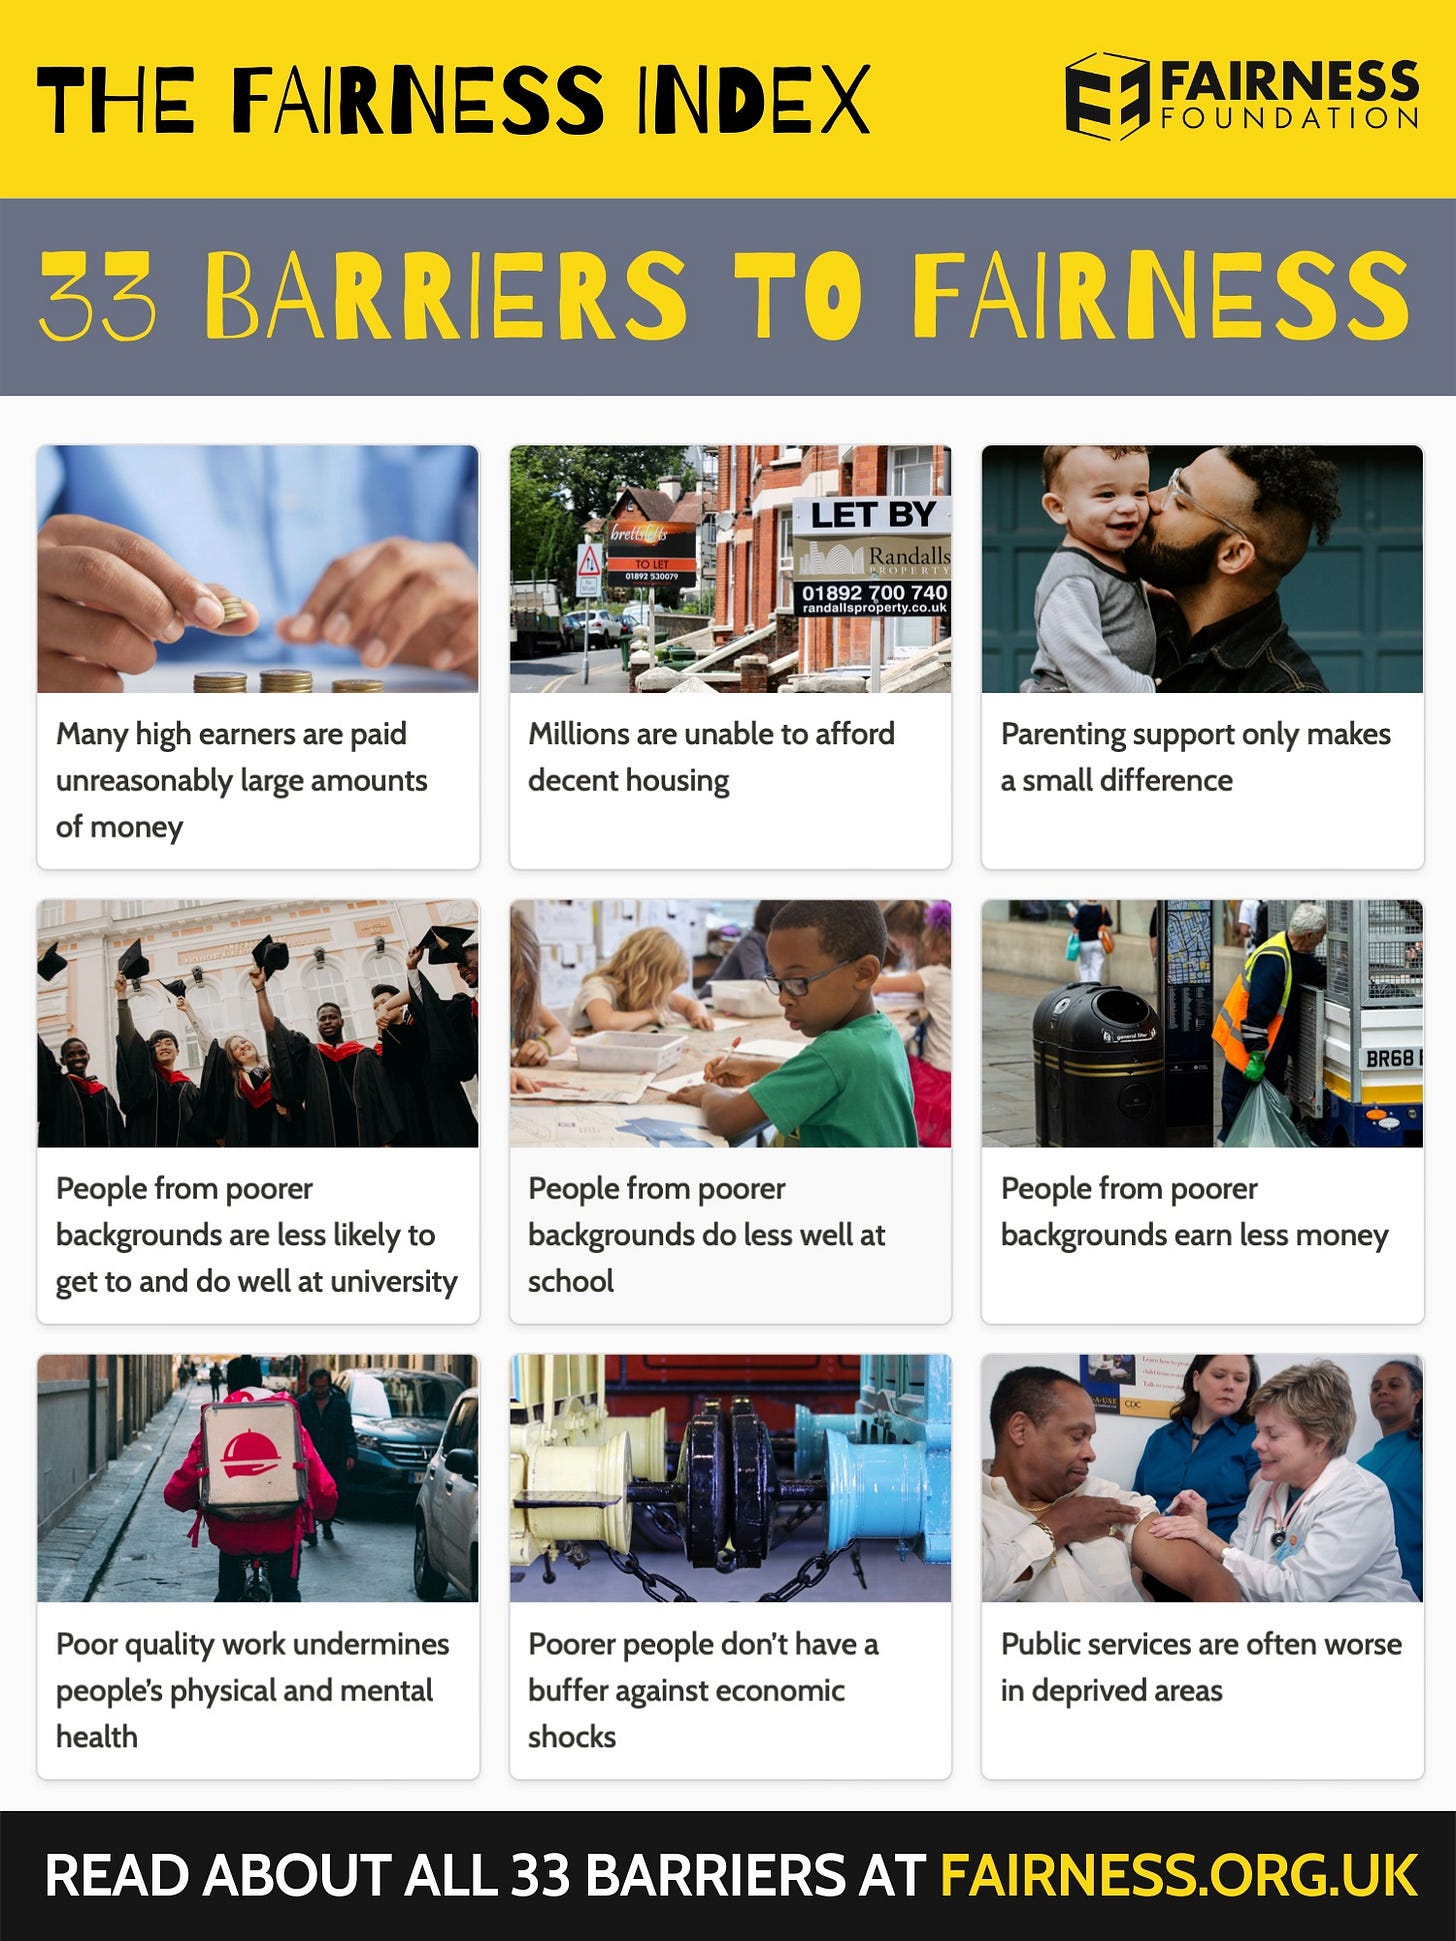
Now I’m going to segue seamlessly into talking about fairness. Last October, we published the Fairness Index:
The index looks at 15 indicators, three for each of the five Fair Necessities, to explore whether we live in a fair society, how and why certain inequalities are unfair, and how to make society fairer.
The ‘why’ part was crucial. A key objective was to explain why the highlighted inequalities were unfair - and therefore fixable, rather than being inevitable or even somehow justified.
Towards this end, we published a set of 33 key arguments about the causes and consequences of the gaps highlighted in the index (including why they are unfair). In each case, we presented a small number of supporting arguments from highlighted third-party reports, alongside links to those reports.
I like to think of those arguments as the fairness equivalent of LEGO bricks. (They’re not a comprehensive list, needless to say - everyone always needs more LEGO bricks.) The arguments can be combined and assembled in different ways to help to explain how and why newly emerging or suddenly topical inequalities are unfair.
Let’s take one relatively live example (no, not unidentified flying objects over North America): bankers’ bonuses.
It’s bonus season, and there’s been plenty of moaning about the fact that investment bankers are seeing their pay packages down by about a third compared to last year. This is nothing to do with the bonus cap - the lifting of which is still up in the air pending a consultation, and the effectiveness of which is questionable - it’s largely the consequence of market forces. But I’m more interested in why bankers are paid so much more than most other people in the first place.
I want to construct an argument about how our society and economy rewards some people excessively, while failing to reward others enough (or at all). Let’s see how I can use the arguments in the Fairness Index to do this, much more quickly than building something from scratch (but without resorting to ChatGPT).
Whether you define merit in terms of talent, effort, or contribution, there is little discernible link between merit and reward. Instead, the structure of the labour market channels disproportionate rewards to particular professions, while failing to adequately reward other forms of work. As a result, many people doing critical work, including but not limited to key workers, are underpaid, while millions of people, most of them women, carry out crucial care work for no money at all. Even if we were able to construct a perfect meritocracy where no one was disadvantaged by the impact of their circumstances at birth on their wealth, education and so on, the system would still not be fair because of the impact of luck (in terms of the genetic lottery of talents and skills, how much our talents and skills are valued and remunerated, and the fact that unequal outcomes in one generation produce unequal opportunities in the next, leading inescapably to a hierarchical society defined by hubris for those at the top and humiliation for those at the bottom). From there is little relationship between merit and reward
Inherited wealth accounts for 28% of wealth in the UK, a proportion that is growing as wealth becomes more concentrated at the top. At the same time, a lot of wealth comes from high incomes. However, those people in the top 0.1% who do work often work for organisations that collect rent, interest, dividends, capital or speculative gains, rather than making a genuine contribution to the economy by creating wealth. This includes people working in finance, insurance and property; but companies in other sectors are also making increasing profits by ‘investing’ in securities (as opposed to making productive investments in new products, services, human capital, technology or infrastructure). From many high earners are paid unreasonably large amounts of money
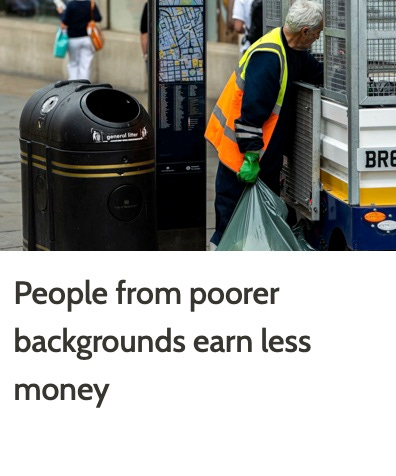
The average 40-year-old graduate earns twice as much as someone with nothing more than GCSEs, and at least some of this difference is due to the impact of education on life outcomes, rather than on ‘meritocratic’ processes to select people by ability. People with fewer qualifications also earn less over the course of their lives. Income is a much bigger predictor of educational attainment than geography, gender or ethnicity. From people from poorer backgrounds earn less money
We need to pay more attention to the role of genetic differences in determining educational outcomes. And we should reflect more than we do on whether society should value and reward those who are genetically endowed with high levels of cognitive intelligence over those with other talents that might be just as socially (and economically) valuable. From genetic differences only play a small part in determining educational outcomes
In most countries, education has done little to improve social mobility, which is low in the UK for both high and low earners. The home environment that children grow up in and their work situation are at least as important in determining future prospects. The likelihood of climbing the ladder in terms of income or class is heavily influenced by family background. Home ownership rates are increasingly immobile across generations. The pandemic has also reduced social mobility because children from disadvantaged backgrounds lost more learning hours when schools were closed. From high levels of inequality lead to low levels of social mobility
We can make opportunities fairer by helping people to get through or around the key bottlenecks that influence people’s life chances. These include poverty, developmental opportunities in early childhood, and access to higher education. From disadvantage undermines people’s capabilities and opportunities
I hope that the Fairness Index could help you to build your own arguments as to why particular inequalities are unfair. Please let me know if you have any thoughts about how this could help you, or how we could make it more useful in the future (we’ll be publishing an updated version of the index in the autumn).


